
Linear Regression Analysis
Regression analysis is a technique to better understand a certain outcome (a phenomenon or behaviour for example), called the dependent variable. This better understanding can be achieved by using a number of explanatory or independent variables that help to “explain” or predict the dependent variable. Specifically, regression analysis is used to quantify the relationship between the dependent variable and one or more of these independent variables
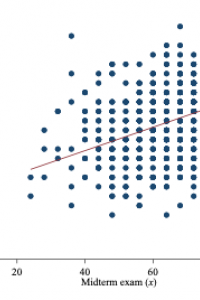
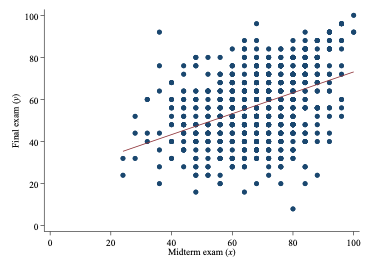
The dependent variable could be university students’ scores at their final exam, which is dependent on various other factors, of which one is the students’ scores at the midterm exam. One would expect a positive relationship between the two variables. This is visually illustrated in the figure below.
Another example
In a similar way, Brunet Marks and Moss (2016) use data from students at two law schools to explain their study success. Hence, the students’ grades are used as the dependent variable, while various independent variables are used to explain study success, such as measures of students’ academic ability, emotional intelligence and some demographic aspects.
Which data can be analysed with regression analysis?
Regression analysis uses quantitative data, such as data resulting from a survey among respondents. Respondents could be students, consumers, lawyers, but regression analysis can also use information from firms, countries, and combinations of these levels of analysis (although in that case multi-level regression analysis is to be preferred).
The dependent variable in a linear regression model is always a continuous variable, that is, it can take a wide range of values. Often used dependent variables are individuals’ salaries or firms’ profits. There are fewer restrictions for the independent variables; they can have various properties, such as having two values (for example, a “dummy variable” consisting of 1’s and 0’s), or containing multiple unordered categories (for example the legal status of a business).
Ceteris paribus
Usually, there are various independent variables that can be included in the model (that is, more than one). These variables are based on theory, previous studies on the same outcome, or logical reasoning. If one is interested in the relationship between salary (the dependent) and education (the independent) it is important to include other relevant independent variables to the model such that they can be hold fixed. For example, the coefficient of education tells us the change in the average value of salary corresponding to an additional year of education, while the values of the other independent variables are held constant. This so-called ceteris paribus condition is an essential interpretation in regression models. In this way, one is able to assess the relationship between salary and education for equal levels of, for example, work experience and for individuals with similar demographic characteristics (these variables are called control variables).
Resources
-
- Brunet Marks, A., & Moss, S. A. (2016). What predicts law student success? A longitudinal study correlating law student applicant data and law school outcomes. Journal of Empirical Legal Studies, 13(2), 205-265.
-
- Finkelstein, M. O. (2009). Basic concepts of probability and statistics in the law. Springer. Chapter 11.
-
- Gulseven, Osman (2020), “Dataset on Student Exam Performance by Gender and Exam Type”, Mendeley Data, V1, doi: 10.17632/49k3rnrwkk.1